Instagram Stories Analytics and Insights: Complete Guide

Awesome Social
Published on:
September 15 , 2023
·12 min read

Instagram is one of the most prominent social media platforms in the world, with over one billion monthly active users. This social media app is notably widespread in India and the United States, where there are 201 million and 157 million Instagram users, respectively. In 2023, the volume of Instagram users in the United States is expected to exceed 120 million MAU. Additionally, Instagram Stories is one of the most beloved features. Users can upload photographs and videos to their Stories stream, which remain visible for 24 hours before disappearing. In January 2019, the business announced that 500 million people were using Instagram Stories daily.

Instagram Stories can help your company connect with customers, enhance engagement, and increase revenue. You can't grow, though, unless you know which of your approaches are effective and which aren't. You must assess your existing Instagram Stories performance in order to develop an effective plan.
As you are probably aware, the stories of people you follow stay at the top of your feed with a colorful ring to signify that a new story has been shared. When you share a brand new Story, your viewers will be alerted, making it more difficult to miss than a typical Instagram post. According to an Instagram story study, sharing up to 5 stories every day sustains retention rates at above 70%.
You must check the popularity of various Stories using your Instagram metrics. The analytics will provide you with a comprehensive list of key indicators as well as the ability to see if your Instagram Stories views are decreasing. To see which stories did better, rank them by story impressions. Examine the sort of content, the times of the week, and the editorial techniques.
These are some factors and questions you must keep in mind while analyzing your Instagram Story's statistics:
● Number of people who have seen the story
● How many distinct or unique accounts watched your Story?
● The number of likes and comments on an Instagram Story.
● The number of times a link shared in a Story has been clicked.
● The overall number of taps to exit your story
● Backward taps, or the number of people who pressed to see the earlier Story Forward taps or the number of people who tapped to see your upcoming Story.
Determining which Instagram indicators to monitor can seem difficult if you're new to the realm of research and analytics. Studying and evaluating these indicators can be transformative for your brand's development once you're up to snuff. When it relates to tracking your brand's Instagram progress, one of the most crucial metrics to consider is reach. If you want to raise brand exposure and reach the largest potential audience, you should concentrate on expanding your Instagram reach.
It's also worth noting that the Instagram app only saves your Stories stats for two weeks. This makes it all the more essential for your brand to track these metrics when your post the Story. An excellent way of ensuring no data is lost, is by adding Stories to a highlight reel which gives you a 48-hour timeframe to view how many users are engaging with your Instagram Story. But before we get into the various metrics you must measure and how they can help your marketing strategy, let's delve into how you can check your Instagram Story view count.
How to check your Story Views
Instagram Stories offer brands and influencers a powerful manner of appealing to audiences worldwide. So when we start creating Stories, we expect the view counts to gradually rise with the increase in followers and when we gain more traction on the platform. If your Instagram Story is still active — that is, if it has been less than 24 hours after you posted it — simply hit the Instagram Story symbol on the app's home page to check the number of people who have seen it.
Here's how to do it:
● To access your story, tap the Your Story circle in the upper corner of the Instagram main feed.

● Alternatively, you can also go to your Instagram profile and tap the icon or picture that depicts your profile.
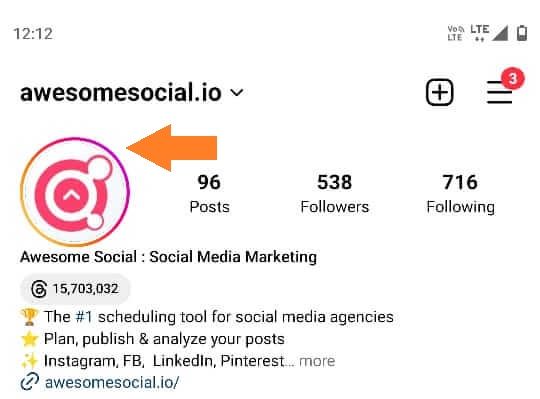
● Once you can see your Story, swipe upwards, and a list of viewers will appear with the number of views next to the eye symbol
That's about it when it comes to viewing your Story Views. If your Instagram Stories receive a lot of attention, your engagement is bound to rise as well. Viewers of your Instagram Stories might decide to remember you or buy something from you after watching a story. As a result, the higher views your Instagram Stories receive, the better. Now that we know how to access your Instagram story view count, let's get right into what metrics you must measure when tracking the performance of your Instagram Stories.
Instagram Stories Key Performance Indicators
Monitoring key performance indicators are critical because it helps you to examine Stories that generate the greatest interaction, address pain areas, raise brand recognition, and target your audience so that the correct message is sent to the appropriate person. These social media analytics are crucial because they allow you to enhance the performance of your Instagram stories and the frequency with which you post.
If you observe an upsurge in reach, it could be because your Instagram stories are higher quality or more shareable, which is a great sign for your Instagram marketing journey. But if you see a sudden decline in reach it means you need to step it up and provide your audience with the high-quality content they want.
Consumers use Instagram to find new businesses and products, with the majority claiming to be more attracted by a business or product after seeing it on Instagram Stories. Likes, replies, saves, and other traditional social media stats aren't available on Instagram stories. Because Instagram has yet to roll out features to track engagement and navigation data, we'll concentrate on reach and impressions in this section. We'll go into these metrics in depth in the next few paragraphs. But first, let's figure out how you can access the analytics and insights on Instagram. Ensure that you own an Instagram business or creative account to monitor metrics for your Instagram Stories. To see your Instagram Stories analytics, go to:
● Go to your profile in the Instagram app.

● In the upper right area, tap the menu symbol and select Insights.
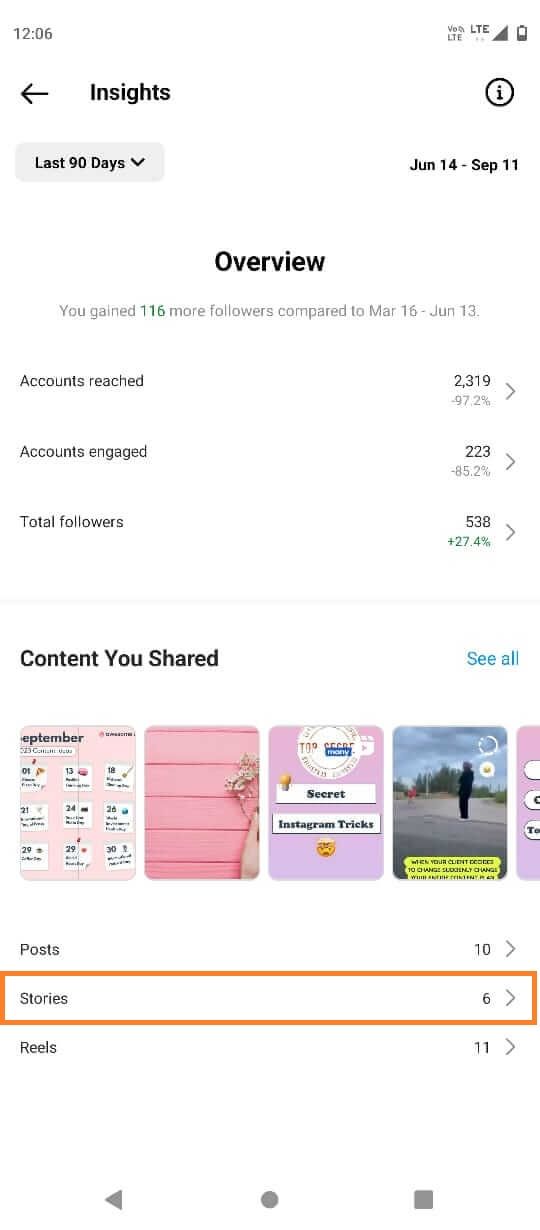
● Scroll down to Stories and click See All to see all of the Stories that have been published in the last 7 days, 30 days or 90 days.
● To receive a summary of all the activities taken throughout your Stories, choose an action, such as Reach or Impressions.
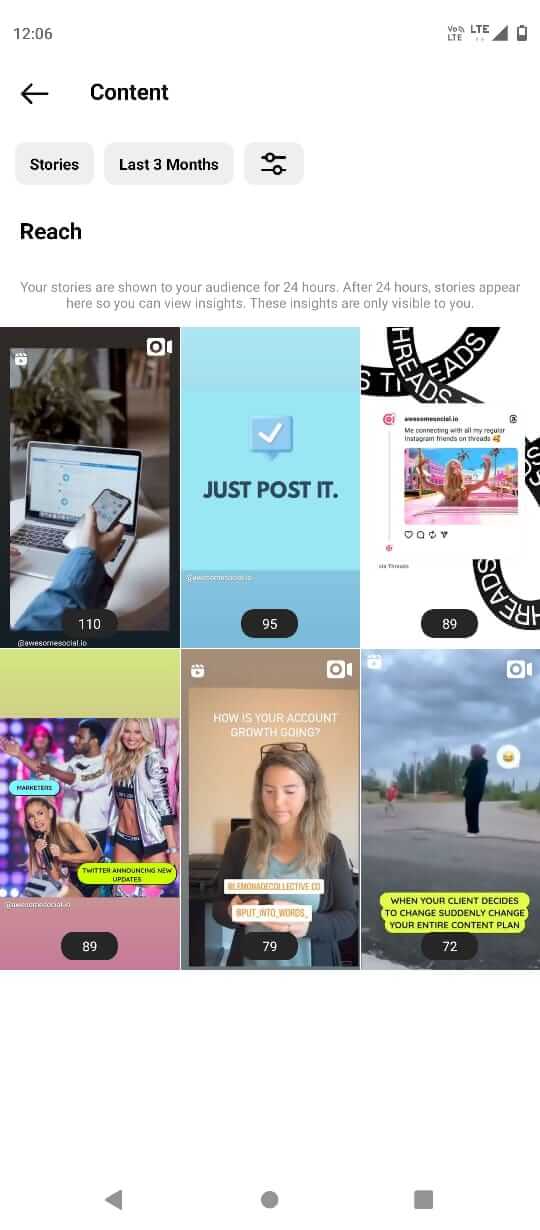
● Swipe up to see statistics for a specific story.
Instagram Stories, on the whole, have a lower reach and a higher impression rate. The strength of your following will determine how many people see your Instagram Story. Furthermore, another crucial aspect of your Instagram Story statistics is your discovery rate. Seeing as Instagram doesn't distinguish between Instagram profiles that follow you and those that don't, discovery on Instagram Stories is difficult to assess.
Reach reveals the audience size of your Stories. However, keep a watch on account visits, follows, and website traffic to delve deep into discovery rates. These stats reflect viewers who, most likely, weren't already following you but were interested in your content enough to look you up on social media, click the follow icon, or go to your website. View Shares as well. A share is a fantastic method to be noticed and can result in more followers who fall under your demographic. We'll delve into these statistics in the next section.
These are the key performance indicators you must track in order to measure your success on the platform:
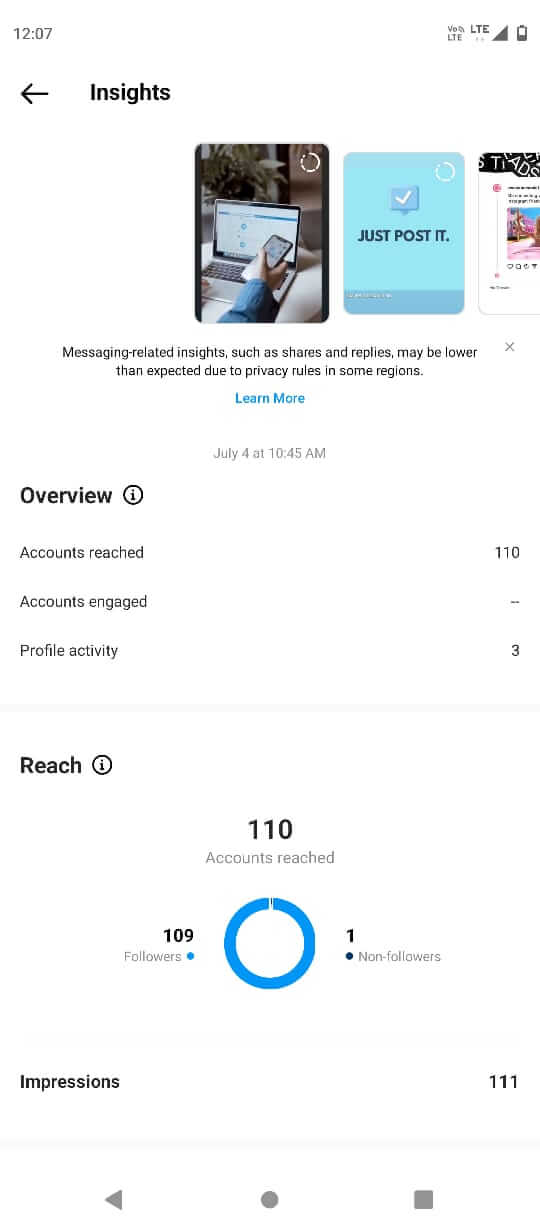
● Reach: this refers to the number of users that have seen your story. Instagram Stories has a reach rate of roughly 7.2 percent of your Instagram followers. Furthermore, one out of every four Gen Zers and millennials deliberately seeks out Stories about the items and solutions they're considering purchasing.
● Impressions: This refers to the total number of times your story was viewed. This includes views that were repeated multiple times by the same person. Impressions provide more detailed information than reach, including information on how many times a user has watched your story. Your content was likely repeated numerous times if your cumulative impressions exceed your reach. It will rarely be the other way around; your impressions will frequently be more than your reach.
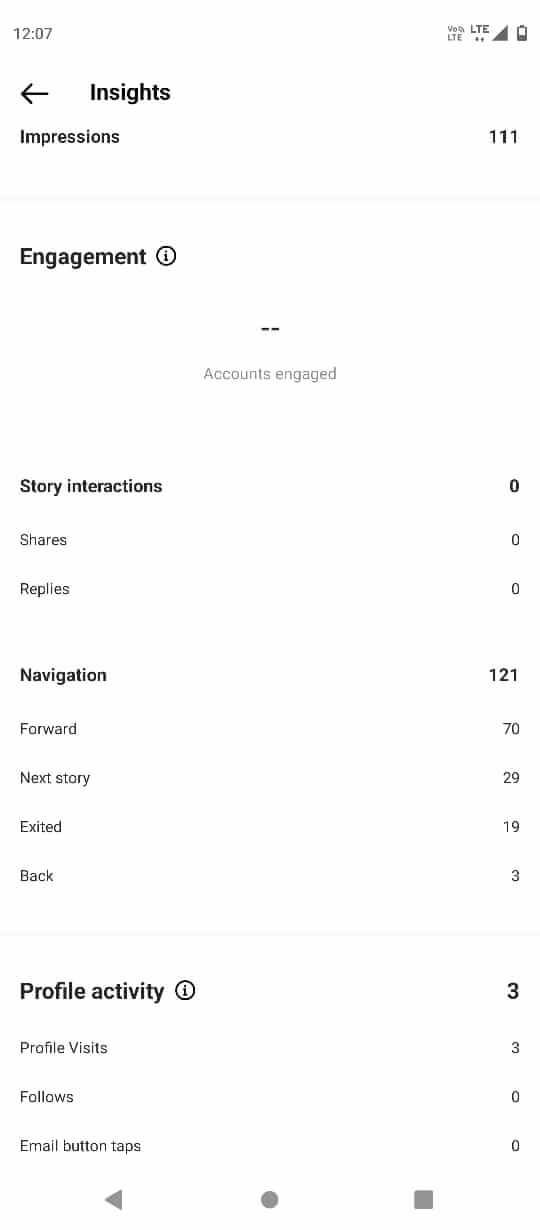
● Taps forward: The number of times a viewer taps to advance to the following section of your story.
● Taps backward: The number of times a user taps to return to a prior section of your story. People may go back and devote more time exploring your content if they tap more backward, which can indicate that they have viewed it in greater detail and find it intriguing. Taps ahead may indicate that some of the story's slides are tedious or don't provide enough details. In general, it is better to have taps backward than taps forward.
● Replies: these are the number of messages that have been sent to you via your story's Send Message option.
● Swipes away: The number of instances when someone swipes to go on to the story of the next profile's story. This is also called the Next Story metric.
● Exits: The number of times a viewer leaves a story to go back to scrolling on their feed. Exits are, by definition, when a visitor exits from your story. This does not imply that they turned around or moved backward. This implies that:
● The viewer pressed the x button.
● Swiped to the next profile's story
● Exited the app
● Left the Story thread to the explore page or their feed.
Exits are perceived as being less bad in comparison to Next Story Taps. As an example, if a viewer leaves your story, it can simply be because they had not had enough time to watch stories. Additionally, they might have swiped up to see more of your story including a meaningful link to your website. These analytics can also be very informative and reveal areas of your content strategy where improvement is needed to keep your audience's interest. You might want to think about examining the caliber of your material if you're noticing a bunch of next or exits for your stories.
Apart from this, the primary objective of the story is to have a lower rate of exits when compared to reach. You will also notice a subsection with Interactions in the story insights overview, which may include the following information: replies, website visits, and profile searches. The total number of Back, Forward, Next Story, and Exited actions you took while reading your story is available to view in your Navigation metric. Navigation metrics let you know what is and isn't effective.
A large number of viewers leaving the page or moving on to the next story is a sign that your content isn't engaging them. Back taps, on the other end, imply that your story included information or substance that readers wanted to see repeatedly. Lastly, the Sticker Taps KPI, which displays the frequency with which users have clicked on a hashtag, geolocation tag, mention, or brand sticker on your Story, is another insight that needs to be measured and analyzed in your Instagram Story metrics.
Hashtags, locations, mentions, and product tags are all typically included in Instagram stories under the Sticker section. Stickers are essentially tags that users can tap to view relevant content, in other words. These stickers, like tags used elsewhere, can contribute to spreading the word about a story. Sticker taps are included in interactions and can be accessed there. You won't see this measurement if you're not using any stickers.
Instagram also released a feature called Growth Insights that lets you see whose Stories and posts received the most followers. Visit Instagram Insights' Audience tab to view these insights. You can view a chart showing follower growth by each day of the week by scrolling down to Growth. With that we reach the end of this section, in the next section, we'll get into how you can measure traffic from your Stories and more!
Different metrics you must measure for success
1) How to track traffic on Instagram Stories
As most marketers know, you can use Instagram Stories to promote your company by sharing information that directs people to your webpage. You can drive followers to your website to buy your merchandise if you operate a shopping or e-commerce enterprise. According to a recent Facebook study, one out of every three Instagram users were more intrigued by a business or product after viewing it on Instagram Stories.
Instagram doesn't provide many options for sending users to websites outside of the app, in contrast to the majority of social networks. Before Instagram introduced the Swipe Up option for Stories, marketers were limited to using "link in bio" call-to-actions.
Measuring how many individuals Swipe Up is challenging. Adding UTM parameters is the most effective strategy to accurately track this metric. You can trace website visitors and the sources of their traffic by adding these shortcodes to URLs. So that users can continue swiping outside of the 24-hour window, and highlight Stories with links. Visits to the website can also be tracked. This counts the number of individuals who click on the link in your biography after viewing your story.
2) Measure your Mentions
Instagram recently improved the tracking of story mentions for creative and business accounts. Just at top of the Activity page, you can now view any stories that mention you. Tap the heart icon, followed by Mentions beneath Stories About You, to view Stories About You. After this, you can browse through each post, include them in your own Stories, or just express gratitude for the support. This includes when consumers display the sticker that says "Support Small Businesses." Several clients from your shop may use this sticker while showing off the products they bought from your store. A small business owner will definitely profit from the increased visibility.
Examine your direct messages to view your notifications to find out who has mentioned you. Generally, this method is the simplest, but it has a drawback in that you might not be able to follow and monitor everyone who mentioned you, especially if your business is likely to be discussed by a large group of individuals. Since Instagram has shown to be a successful marketing platform, many businesses prefer to employ a management solution so they can focus more of their time on marketing than on time-consuming technicalities and content scheduling. We recommend Awesome Social, which is an excellent social media management and scheduling tool for all platforms.
3) The Swipe Up metric
Tracking the amount of times users "swipe up" on your Instagram Stories is a terrific method to determine what kind of posts are effective for driving traffic, and whether you utilize clickable links to promote online campaigns, product sites, or blog articles.
Consider adding text that instructs users to "Swipe up!" or an arrow referring to the bottom of your interface if your swipe-up rates are low. You may use the charming "swipe up" Instagram Stories GIFs as well. It's possible that your audience is oblivious to the link and requires a little prompting. This metric is crucial to measure whenever you create ad campaigns and include clickable links in your Stories.
4) Check your replies consistently
Replies are the number of times somebody has personally responded to a section of your story, much like comments are for photographs and videos. However, unlike comments on a picture or video, these reactions are only visible in your DMS and are not visible to the public. An excellent strategy to increase your engagement and interaction on Instagram is to make Instagram Stories that invite feedback from your followers.
Pay special attention to the types of content that encourage your followers to interact with you, and use these occasions to engage with your audience in the future. Not only will these exchanges help maintain your Instagram Stories at the forefront of your followers' feeds, but they will also help you build stronger relationships with them.
5) The discovery metric
You can also see how many people watched your story if it is included in an Instagram hashtag or location story by visiting the Explore page. Instagram notifies you when your story is included in search results for a place, and you may also see it at the beginning of your story. When browsing as to who viewed your story in your Instagram Stories metrics, you'll see the name of the page the person came from when they viewed it from a hashtag or geographical page. You can also see how frequently your followers share your Instagram Stories.
As we've previously mentioned, the more shares, saves, and likes you receive the better.
Instagram Stories Analytics and Insights in Summary
Learning the ins and outs of Instagram analytics is challenging. However, it is necessary if you want to thrive in the unforgiving world of businesses and influencers vying for attention. How will you gauge the success of your strategies if you don't comprehend the metrics? How will you accomplish your objective without knowing which strategies work better? A solid Instagram marketing plan has a clear objective, doable strategies, and quantifiable performance indicators.
You can identify your highest ranking posts by analyzing how your Stories perform over time. Look for strategies to replicate any images or videos that stand out from other Stories. Additionally, never forget that qualitative data is just as crucial as empirical information. Pay heed to feedback whether you employed questions, quizzes, or poll stickers to get your audience involved.
Utilize customer feedback to create new content, services, or goods. And don't be shy about asking outright. People prefer to have their opinions heard.
Free Instagram tools:
- Free Hashtag Generator
- Image splitter & Instagram Grid Maker
- Instagram Line Break
- Image Resizer for Instagram